How do you decide if something is on the frontier?
I’m a little bit confused. I’ll often want to do analysis which says: take a set of data points, figure out which of the ones are, on the frontier or that are state-of-the-art at the time they are made available, and then plot a trend line so that you can accurately guess what the frontier will be in the future.
But it’s pretty unclear to me how you actually figure out whether something is on the frontier. Specifically in the case that there is a just barely state of the art release, quite a while after the earlier state of the art by, for example, a company that is generally lagging behind, and then a substantial gain shortly after that, it seems wrong to include the intermediate SOTA as part of the frontier when you are projecting for what the future frontier will be.
The left indicates what I mean by “barely SOTA by a laggard”
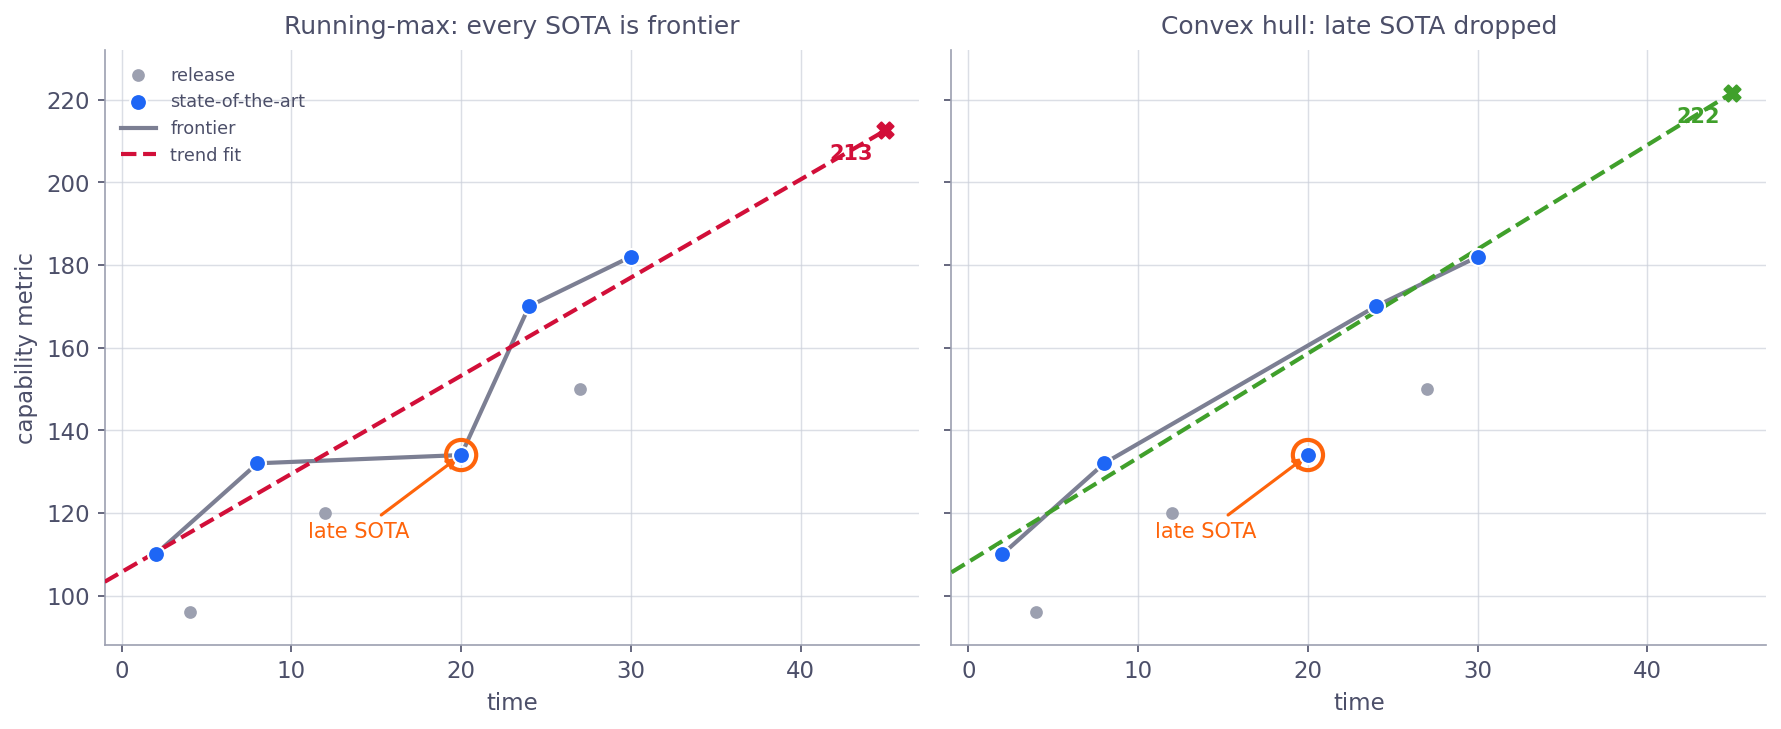
On the other hand, we can instead model SOTA only if it lies on the convex hull, which seems somewhat intuitive to me. You still get the same issue where the late SOTA brings down the trend while it is SOTA, but when it gets overtaken, it no longer gets included in the trend calculation. So certainly an improvement, though not perfect. My guess is that you may need to motivate modeling things using the convex hull, and have an explanation for why points once on the frontier can be “erased from history” so to speak.
And then there’s people like the folks who made this benchmark, and draw fits to the “rolling top-2 models”.
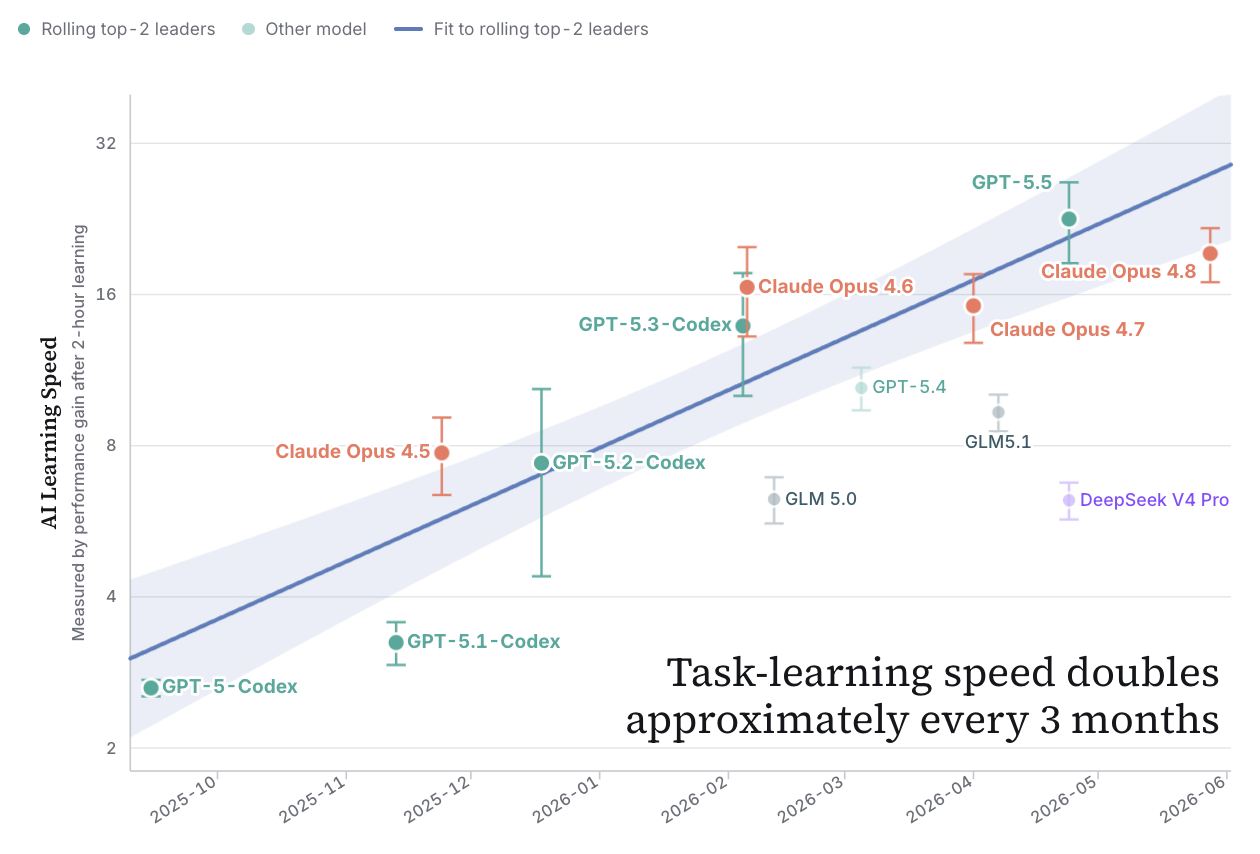
TODO I’d like to backtest this on a number of AI-related curves and see whether the convex hull is actually a better predictor of e.g. post-june 2025 data than the running maximum.
Okay, the hull seems to me to be more principled. The claim is simply that the laggard data points more often than not are not giving you information about the “rate of progress”. It’s something like, while they are state of the art, they are, but then when you see the next point above it, that should update your understanding of what should have constituted SOTA. I.e. going back and erasing that datapoint from your memory is indeed the right move fairly often. The alternative is something like “rot”, where each of these laggard points pulls the trendline down forever.
The x-axis of course needn’t be time—. And indeed when it’s not time, but instead something you can measure/vary, then